Paul Middendorf
Wyatt Dunn
04/13/16
Project Overview
We are studying Twitter. Twitter is a social network that allows users to send “tweets”. Tweets are visible to the public and are limited to 140 characters. We are specifically interested in the tweets, especially the content, location of the tweets and the time when they were posted. Twitter has 289 million active users[1]. These users send about 500 million tweets a day[2]. This massive amount of tweets is like a “stream of consciousness” for the general public. So if one was to take the general opinion or reaction of twitter as a whole in response to a certain event, they could generalize that as representative of the opinion of the public at large.
Which #commercial will cause a controversy tonight? Guess correctly and you'll win a prize #SuperBowl #SB50
— Tuna Palace (@TheTunaPalace) February 7, 2016
This is an example tweet
This easily accessible large dataset that effectively represents so well the general opinion lead us to wonder if we could draw some conclusions about how people react to popular events. In the past this would have been almost impossible to do, but the information available through Twitter makes it possible to get an understanding of how people feel about current events. The datasets are actually so large, that we can even gain an understanding of the mechanics of how people talk about events, how opinions spread, and how long it takes for people to form reactions.
With 500 million tweets in a day there is just far too much data for the scope of this project. It isn’t reasonable for us to try and analyze data about everything that every user is tweeting about. So, we decided to limit our data to only tweets that have some relation to Super Bowl 50. Super Bowl 50 was a massive cultural event, with over 100 million viewers. So, even though this limited the amount of tweets we collected there was still enough people talking about it to allow us to collect enough data to perform an analysis on. Super Bowl 50 can then be thought of as a model that we can then relate to other popular current events such as political debates, large concerts, sports, and eSports.
Twitter publishes a Streaming API that allows anyone with a twitter account to collect tweets in real time. We used a python script called Tweepy to access the twitter API. We collected tweets based on lists of keywords. The categories we used to separate the tweets are commercials, referees, big plays, and the halftime show.
Example of a tweet in JSON format
{
  "created_at":"Mon Feb 08 00:34:42 +0000 2016",
  "id":696492311996313600,
  "id_str":"696492311996313600",
  "text":"RT @mgafni: Lots of people lined up outside Levi's Stadium for halftime show when they can go on field; no Left Shark #SB50 https:\/\/t.co\/te\u2026",
  "source":"\u003ca href=\"https:\/\/about.twitter.com\/products\/tweetdeck\" rel=\"nofollow\"\u003eTweetDeck\u003c\/a\u003e",
  "truncated":false,
  "in_reply_to_status_id":null,
  "in_reply_to_status_id_str":null,
  "in_reply_to_user_id":null,
  "in_reply_to_user_id_str":null,
  "in_reply_to_screen_name":null,
  "user":{
      "id":68433924,
      "id_str":"68433924",
      "name":"Robert Salonga",
      "screen_name":"robertsalonga",
      "location":"San Jose, Oakland",
      "url":"http:\/\/mercurynews.com",
      "description":"Crime & Public Safety, San Jose Mercury News (@mercnews). Bruin\/Terp alum. Middling triathlete. Just the tips: rsalonga@mercurynews.com",
      "protected":false,
      "verified":true,
      "followers_count":2924,
      "friends_count":460,
      "listed_count":180,
      "favourites_count":127,
      "statuses_count":18075,
      "created_at":"Mon Aug 24 15:38:19 +0000 2009",
      "utc_offset":-28800,
      "time_zone":"Pacific Time (US & Canada)",
      "geo_enabled":true,
      "lang":"en",
      "contributors_enabled":false,
      "is_translator":false,
      "profile_background_color":"C0DEED",
      "profile_background_image_url":"http:\/\/abs.twimg.com\/images\/themes\/theme1\/bg.png",
      "profile_background_image_url_https":"https:\/\/abs.twimg.com\/images\/themes\/theme1\/bg.png",
      "profile_background_tile":false,
      "profile_link_color":"0084B4",
      "profile_sidebar_border_color":"C0DEED",
      "profile_sidebar_fill_color":"DDEEF6",
      "profile_text_color":"333333",
      "profile_use_background_image":true,
      "profile_image_url":"http:\/\/pbs.twimg.com\/profile_images\/509219502232330240\/MXxXjb2S_normal.jpeg",
      "profile_image_url_https":"https:\/\/pbs.twimg.com\/profile_images\/509219502232330240\/MXxXjb2S_normal.jpeg",
      "profile_banner_url":"https:\/\/pbs.twimg.com\/profile_banners\/68433924\/1431536609",
      "default_profile":true,
      "default_profile_image":false,
      "following":null,
      "follow_request_sent":null,
      "notifications":null
  },
 "geo":null,
 "coordinates":null,
 "place":null,
 "contributors":null,
 "favorited":false,
 "retweeted":false,
 "possibly_sensitive":false,
 "filter_level":"low",
 "lang":"en",
 "timestamp_ms":"1454891682038"
}
This is what a tweet looks like as it comes from the Streaming API
For more information on our data collection please see our data collection page.
As you can see every tweet has a wealth of data associated with it. We are mainly interested in the “text”, “created_at”, and “location” fields. Due to the nature of the data collection the tweets are spread across a large number of separate JSON files. To solve this we have a python script that reads every JSON file in the directory and combines them into a single file that contains the entire dataset. Then we have another script that writes the tweets to a .csv file containing only the fields we are interested in. This format makes the data easier to work with in R.
Please click here to see more detail on how we wrangled this data.Data Analysis
So, now we have data. But what are we going to do with it? We have a few hypotheses that we can explore using this data. Firstly, it is intuitive to think that twitter trends will show a reaction to real life events. In this case, a trend is the frequency of tweets about a topic over time. This means that we expect to see a spike in how many and how often people are tweeting about topics related to an event immediately after it happens. We also have a working theory about how these trends will be shaped. We anticipate a rapid and sharp spike immediately following the event, then a slow decay in popularity of related topics in the time after the event. These trends should follow a fairly consistent pattern. We expect the trends that correspond to most events to match the shape described above.
Halftime Show Data
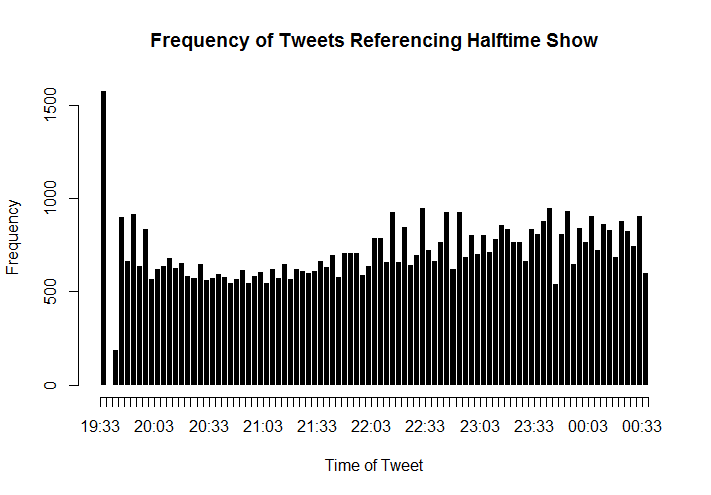
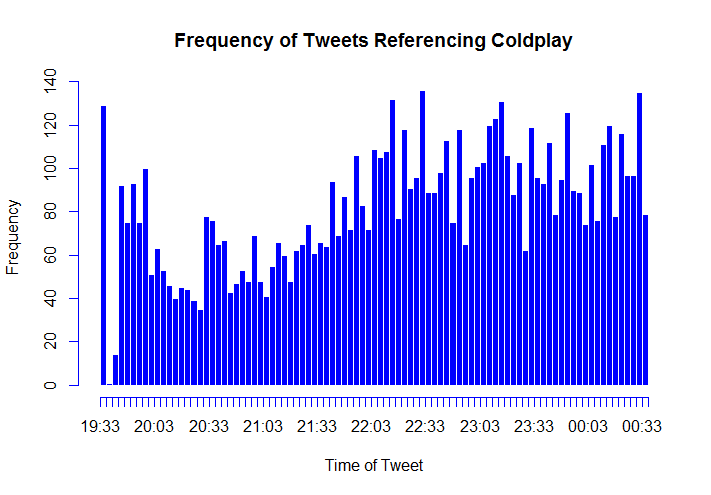
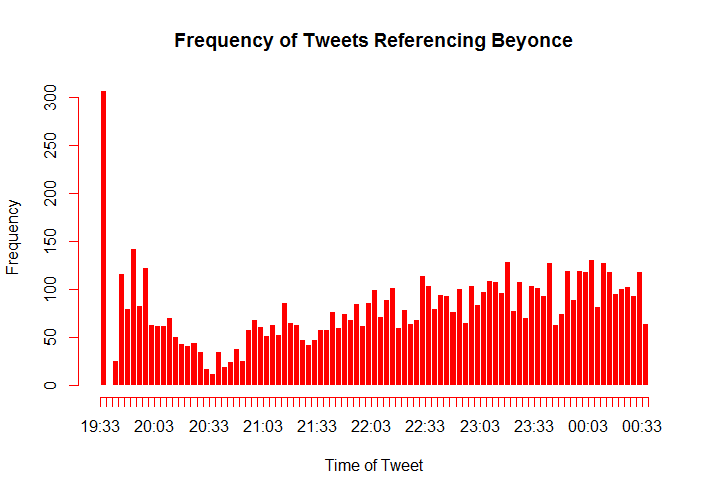
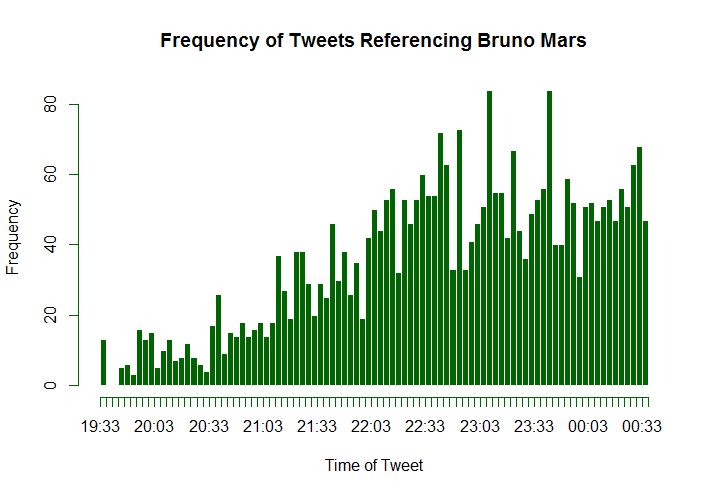
Data relating to tweets referencing the halftime show
Commerical Data
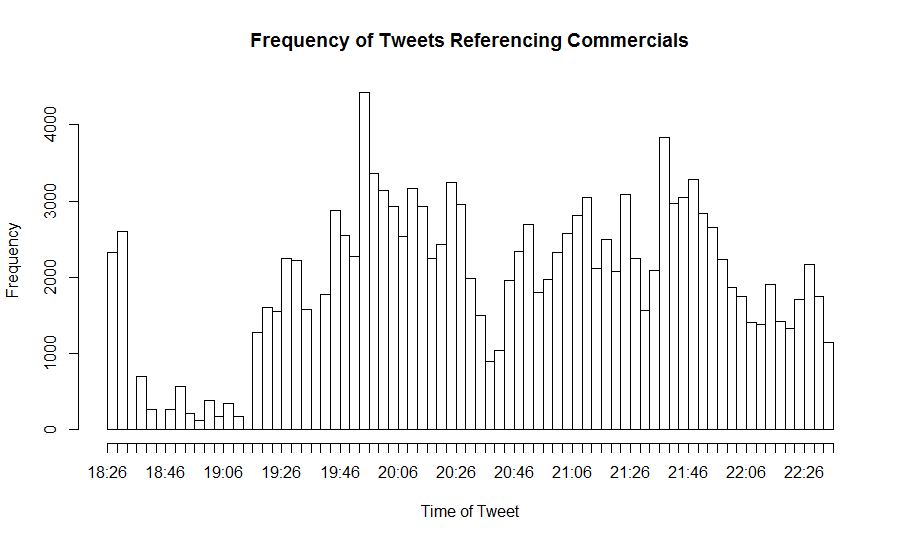
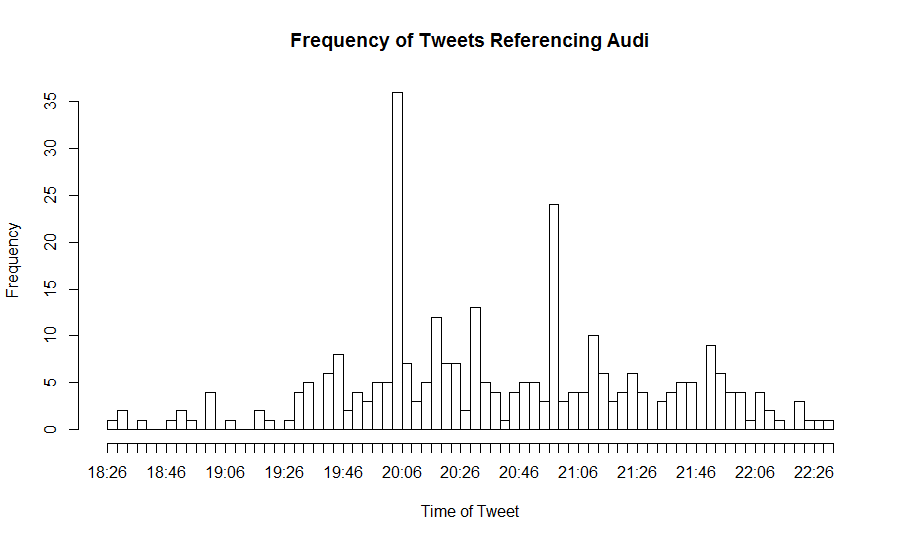
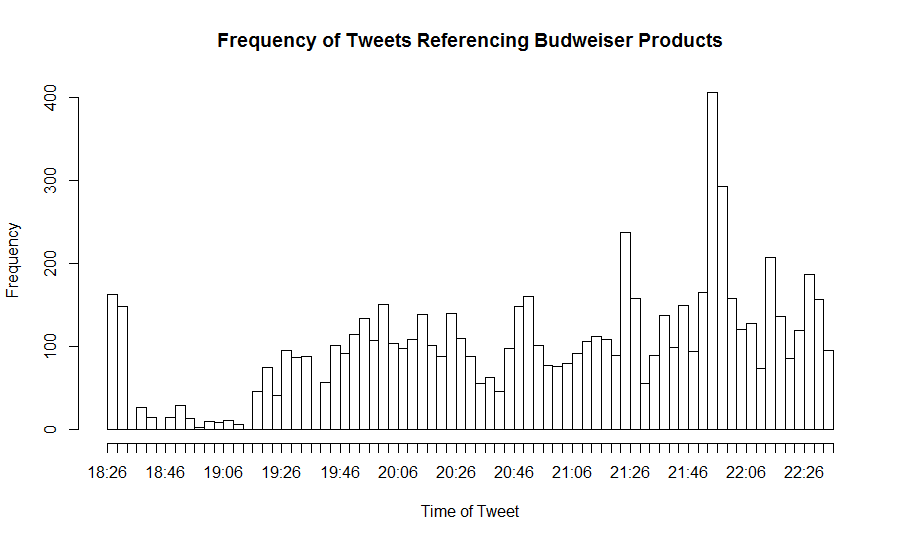
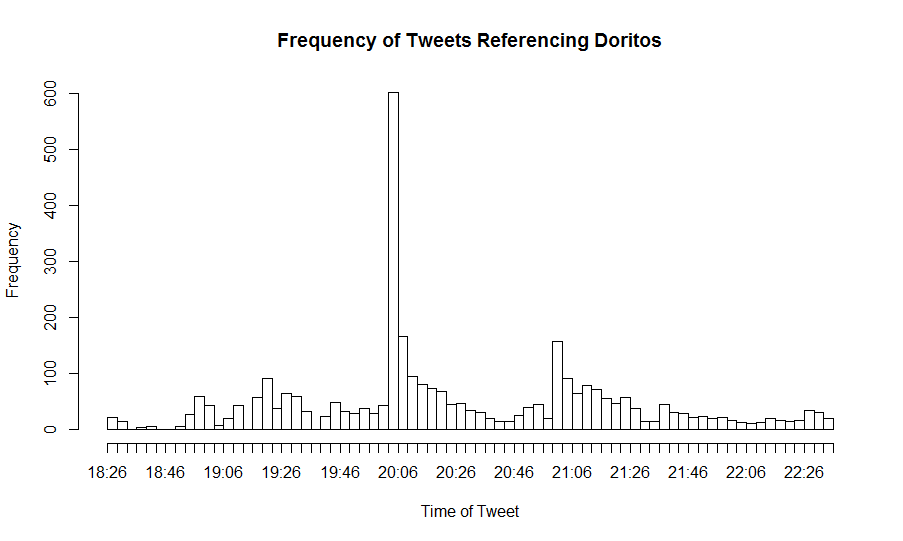
Data relating to tweets referencing commercials
Plays Data
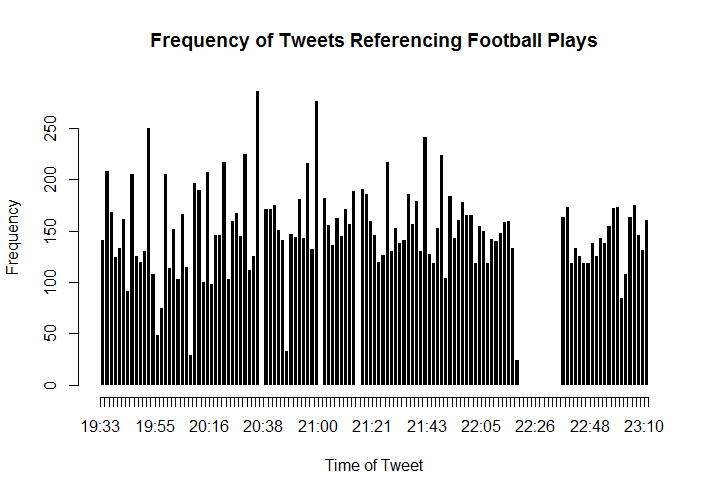
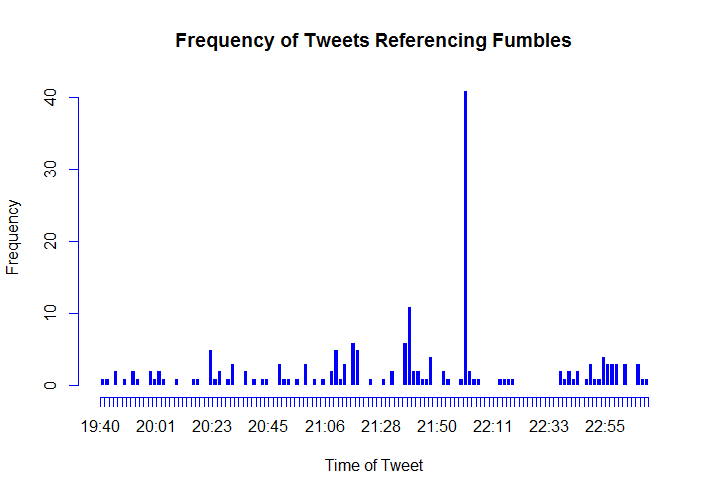
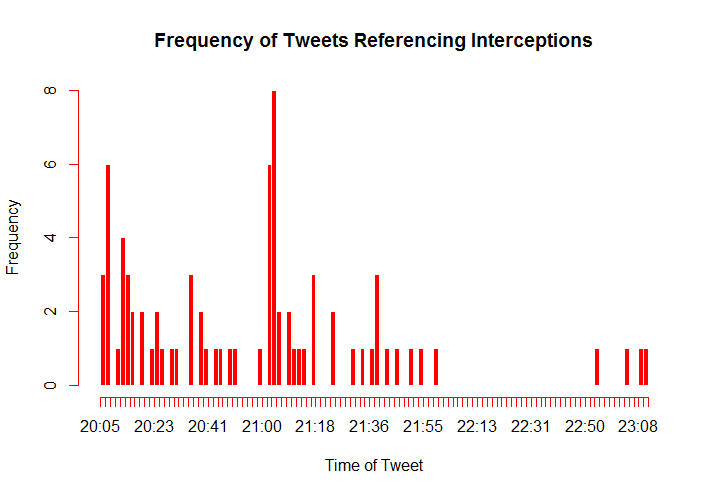
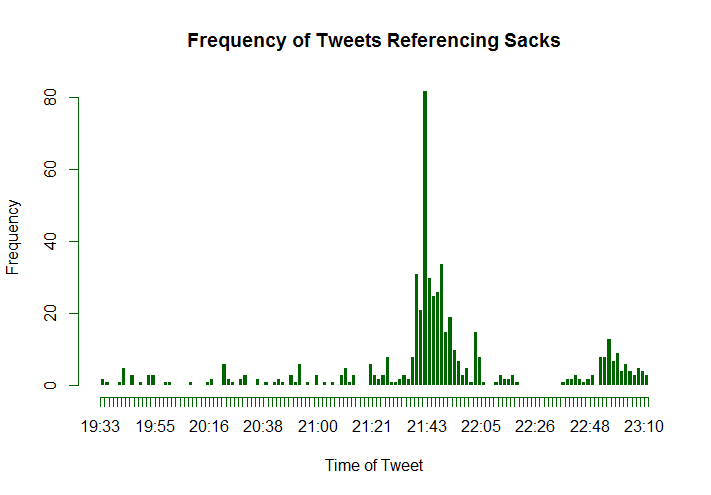
Data relating to tweets referencing football plays
Referee Data
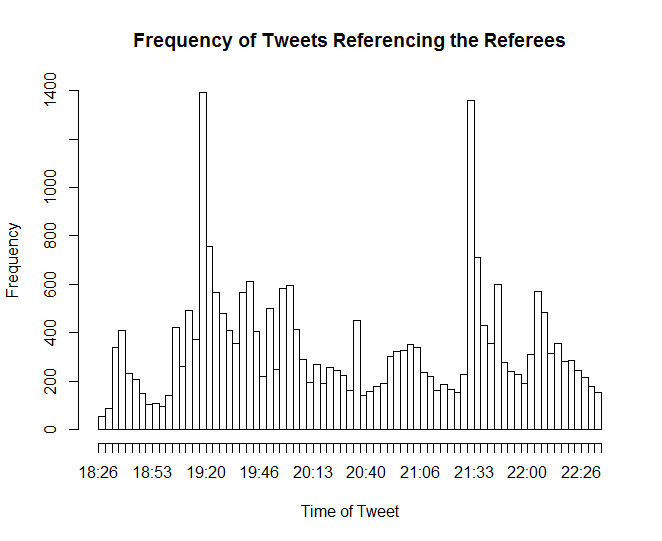
Data relating to tweets referencing the referees
There is also the content of people’s reactions and opinions, ie what are people actually saying, not just how they are saying it. Any Hypothesis we could come up with about this would be dependent on the exact event and the context in which the event happened. Therefore, our general hypothesis is that the general reaction to an event is context sensitive. This makes logical sense, seeing as how nothing really happens in a vacuum. Even the frequency of an event, or if the event has happened before at all could affect the nature of twitter users’ reactions and opinions. Take for instance a turnover in a football game. If the score of the game is ten to ten and a turnover occurs, it is extremely significant to the game and its viewers. We would expect to see a lot of tweets about it, and the content of those tweets to be very emotional and excited. However, if the game is thirty-five to nothing, we would expect the content of the tweets to be more subdued.
All of the code we used for this analysis is available on our github. Please click here for an explanation of how we made these figures.